S.No
|
Parameter Name
|
Data
|
Rating
|
Remarks
%
|
1
|
Gross Profit Margin
|
2008--6%
2009--9%
2010--9%
2011--10%
2012--12%
|
3
|
Gross profit Margin
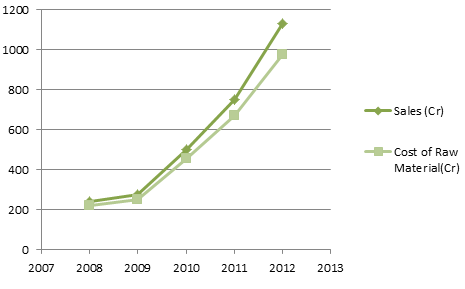
have been consistent , we can see higher margin in 2010 to 2012 due to rising
gold prices.
Due to increase in gold prices ,company could see its finished products at
higher prices.Gross profit margin in this industry are very low as cost if
raw material is generally more than 85% of the sales.It is the nature of
jewellery business

|
2
|
Operating Profit
Margin
|
2008--5%
2009--7%
2010--6%
2011--8%
2012--10%
|
3
|
OP Margin are more
or less consistent.
Operating margin has increased in last 2 years due to same reason as above
|
3
|
Net Profit Margin
|
2008--3%
2009--3%
2010--3%
2011--4%
2012--5%
|
3
|
Consistent and Net
Profit margin has also increased due to rising gold procies.But it should be
noted here that gross , operating and net profit margin are dependent on gold
prices.There is some degree of risk involved here
|
4
|
Selling , General and
Admin expenses
|
2008--11%
2009--15%
2010--21%
2011--15%
2012--14%
|
4
|
SGA expenses are
under control.
They are well under 30% of gross profit so it is fine.
|
5
|
Depreciation %
|
2008--2%
2009--2%
2010--2%
2011--2%
2012--1%
|
4
|
Depreciation cost is
consistent over years and it is well under 7-8% of gross profit
|
6
|
Interest %
|
2008--15%
2009--25%
2010--21%
2011--17%
2012--24%
|
2
|
Company has lot of
debt which is used mainly for working capital and here it is mainly for
purchasing gold.Some amount of debt is also used for opening more stores but
this expense is small compared to utilization in working capital.Company has
to pay interest on this debt and this interest payment is much above 15%.
|
7
|
Net Profit growth rate
for past years
|
2008--6.86 Growth
29%
2009--8.88 Growth 80%
2010--16.07 Growth 94%
2011--31.33 Growth 88%
2012--59.06
|
4
|
Net Profit growth
has been exceptional.Number of stores has increased from 2 in 2008 to 23 in
nov 2012.
Net Profit has been growing at a average rate of 70% for last 5 years
|
8
|
EPS growth rate for past
years
|
2008--7.91 Growth
23%
2009--9.80 Growth 19%
2010--11.71 Growth 95%
2011--22.84 Growth 88%
2012--43.05
|
5
|
EPS has been growing
at average rate of more than 50% for last 5 years
|
9
|
Dividend History
|
2008--5.00%
2009--10.00%
2010--40.00%
2011--50.00%
2012--70.00%
|
4
|
Company has been
paying dividend regularly.
Moreover the dividend yield is also good , in oct 2012 it was around 3.14%
|
10
|
Inventory
|
2008--35.60 Growth
80%
2009--64.30 Growth 81%
2010--116.78 Growth 77%
2011--207.75 Growth 77%
2012--369.23
|
3
|
Inventory growth is
inline with sales and net profit.Inventory has also been increasing as
company is opening new stores.In this case inventory is gold which has got
real value and moreover this value is increasing by time so inventory is fine
here.
One risk could be that if there is sharp decline in gold prices then it can
impact profitability of the company and can lead to exception loss to the
company
|
11
|
Business , Advantage
and Quality of Management
|
Management of the
company is moving in right direction , more and more stores are being added
timely.Company is using ERP for stores and inventory management and also to
manage its financials.
Management is open in reporting concerns which are present in business.For
e.g risk of commodity , risk due to other big competitors are being openly
taken in the annual reports.Company is also planning to open its online
shopping store and it should be ready by 2012 year end
|
4
|
References
-http://www.thehindubusinessline.com/companies/jewellery-industry-witnessing-polarisation-says-thangamayil-jmd/article3750247.ece
Annual report - fy11 - page 31 to 35
|
12
|
Current ratio
|
2008--7.63
2009--6.84
2010--12.27
2011--9.09
2012--7.23
|
4
|
Current ratio is
well above 1
|
13
|
Debt to Equity
|
2008--0.7
2009--1.31
2010--0.93
2011--1.37
2012--1.85
|
2
|
Debt to equity ratio
has been increasing , it is mainly due to opening more and more stores and
also for purchasing gold for these new stores.Company is in expansion
mode.
But debt to equity ratio is still a matter of concern.
|
14
|
Debt/Earnings
|
2008--2.95
2009--4.89
2010--4.36
2011--4.29
2012--4.58
|
3
|
Debt/earnings
indicates that company has good earning power and it is able to pay off its
loans.
|
15
|
Is the Company
generating free cash flow? Capital Expenditure?
|
Capex
2009-- 25
2010-- 62.55
2011-- 87.66
2012-- 179.29
|
3
|
Company is not
generating free cash flow , FCF has been negative for last few years.Below
are the numbers:
Operating cash flow :
2010 : -34Cr
2011: -36Cr
2012 :-67
FCF
2010: -39Cr
2011: -48
2012 : -106
But most of this money has been used to increase inventory i.e to provide
gold to its stores.For e.g in 2011 90 cr of inventory was added , in 2012 52
Cr of inventory is added.
It should be fine in this case as inventory which is gold is very liquid and
its market value is equal or more than what is stated on balance sheet.In
future when number of stores are constant then FCF and OCF should be positive
and increasing yoy.We need to watch this parameter in future
|
16
|
Return on Equity &
Return on assets
|
Return on
Equity
2008--23%
2009--26%
2010--21%
2011--31%
2012--40%
Return on Assets
2008--13%
2009--11%
2010--11%
2011--13%
2012--14%
|
3
|
Return on equity is
good.
one reason for having ROE higher has normal is that company is using lot of
debt which is making ROE higher.
|
17
|
graph of stock price
|
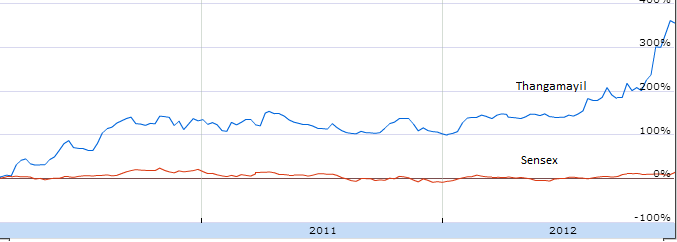
Company got listed
in 2010.
Since then stock price has been on upward trend.It was in range of 180 till
oct 2012 but after that it has made a good run .This run is mainly due to good
results in june and September and also that more and more people are now
become aware of the company.
|
4
|
Volume was normally
in range of 4000 -5000 earlier but in oct -nov 2012 it is in range of
20000-30000.

|
18
|
retained earning
growth rate and its use
|
2008--14.24 Growth
68%
2009--23.96 Growth 155%
2010--61.15 Growth 38%
2011--84.49 Growth 56%
2012--132.39
|
4
|
Retained earning
growth is impressive and retained earnings are mainly used for expansion of
new stores as well as purchasing gold for these stores.
|
19
|
P/E ratio
|
P/E ratio in Nov
2012 - 8.5
Sep 2012 - 5
Jan 2012 - 4
|
5
|
Company sales have
been growing at more than 50% for last 5 years.Net profit has been growing at
more than 60% for last 4 years.
Thangamayil is small cap company with market capitalization of 450Cr in nov
2012.
The company has good potential and it can add more stores which are
profitable then stock price can go higher.
|
20
|
intangile assests ,
brand value and does a company have advantage over others
|
Thangamayil has good
brand image in cities of Tamil Nadu.
As per company current plan , it wants to cover Tamil Nadu first and then
move to other states.
|
4
|
Company is more
focused on rural urban and semi urban areas and it is a popular brand among
people.
It is very difficult to build a brand image in big cities.
Company plan is to first capture market in small cities and then ride on it
brand image to big cities.
|
21
|
are insiders buying
the stocks , is company buying back shares , are mfs holding this company
|
Promoters believe in
the growth story of the company and have been buying companys shares.
|
4
|
promoters holding is
increased from 68.81% in june 2012 to 69.23 % in Sep 12
|
22
|
Growth type of company
and room for expansion
Impact of Industry parameters and Government policies
|
Company is in growth
stage.
It is mainly operating in Tamil Nadu and can add stores in nearby stores. So
next few years are good for expansion.
|
4
|
Company is adding
more and more stores.It has 23 stores as of nov 2012 and the plan is to have
28 stores by march 2013.
|
23
|
do you understand
business , do you have edge in this industry,what do you know which market
does not know
|
The business is
simple.
Purchase raw gold , create jewelery and sell in stores.
There is nothing complex about the business.The concern of fluctuation in
gold prices is there.The other concern is that it is operating in Tamil Nadu
and it has proved itself there.It may also grown in nearby states but its
products will be tested in middle and northern parts of India as people have
wear different style of jewellery there
|
4
|
The big positive
with the stock of this company is that it is not tracked by mutual funds and
other big players.
Once the company becomes popular among biggies then stick price can take a
real jump from here and it can reach P/E of 14-15 where other average
jewellery companies operate
|
24
|
Competition
|
Big players :
Titan: Sales - 8900Cr ,NP margin - 6%, D/E - 0, P/E - 40
Tribhovandas Sales - 1385 Cr, NP margin - 4% , D/E - 1.28 , P/E
(nov 2012) -28.
Gitanjali Gems Sales - 12498 Cr, NP - 4%, D/E - 1.3 , P/E - 9.5
Among all players in the country , Titan is the market leader with strong
brand images.It is nearly a debt free company which is a rare sight in this
industry
|
3
|
Local Players
Madurai has seen the entry of Alukkas Jewellers, Bhima Jewellers andKalyan
Jewellers,
Lalitha Jewellers, Kirthilal jewellery and themajority of themhavepresence in
15 to 20 other cities.
Such new entrants come inwith the financialmuscle that comes out ofmanaging
10 – 15 outlets and
hence have the ability to spend heavily on advertising and on maintaining
higher levels of
inventory.
Similar entryby other players inMadurai aswell as other locations targeted by
Thangamayil could
make businessdifficult andaffect profitability inthe long run.
|
25
|
what company does
,your story on company , why do you think that company will become better
than what it is today, or any other point
|
As of nov 2012 ,
company has 23 stores , giving revenue of about 1350 Cr (last 4 quarters) ,
NP margin is 5% , Net profit - .4*1350 = 67.5Cr.
It has plans to have 28 stores by March 2013.
|
5
|
 Company is on expansion mode and it has added 7 Brand in this year.
If we assume that it adds 5 branches each year for next 5 years then revenue
could be in range of 3000Cr , with current margin Profit could become 150
Cr.Assuming PE of 15 as company will have more brand awareness after 5 years
then market cap could become 2250Cr.Market Cap in nov 2012 is 450Cr.So
potential upside is 2250/450 = 5 times.
So if all is well then in 5 years the stock has potential to become 5 times
in coming 5 years
|


Stock looks really cheap , it should touch 400 after Q3 results
ReplyDelete